| |
Lactate dehydrogenase reaction. From a biochemical perspective, the cellular production of lactate is beneficial for several reasons. First, the lactate dehydrogenase (LDH) reaction also produces cytosolic NAD+, thus supporting the NAD+ substrate demand of the glyceraldehyde 3-phosphate dehydrogenase reaction.
This in turn better maintains the cytosolic redox potential (NAD+/NADH), supports continued substrate flux through phase two of glycolysis, and thereby allows continued ATP regeneration from glycolysis.
Another important function of the LDH reaction is that for every pyruvate molecule catalyzed to lactate and NAD+, there is a proton consumed, which makes this reaction function as a buffer against cellular proton accumulation (acidosis). The chemical structures for the LDH reaction are presented in Fig. 9.
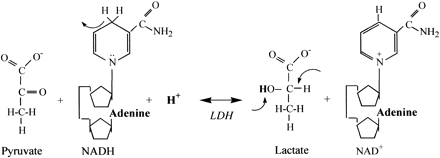
Fig. 9. Substrates and products of the lactate dehydrogenase (LDH) reaction. Two electrons and a proton are removed from NADH and a proton is consumed from solution to reduce pyruvate to lactate. Arrows pointing away from a bond represent bond/group removal. Arrows pointing to a bond represent addition of an atom/group.
____________________________________ |
In the LDH reaction, two electrons and a proton are removed from NADH, and an additional proton is gained from solution to support the two electron and two proton reduction of pyruvate to lactate. Consequently, the LDH reaction is alkalinizing to the cell, not acidifying, as is the basis of the lactic acidosis construct.
There are additional benefits of the LDH reaction. The lactate produced is removed from the cell by the monocarboxylate transporter (12, 20, 21, 30, 37, 62). The lactate is circulated away from the origin cell where it can be taken up and used as a substrate for metabolism in other tissues, such as other muscle cells (skeletal and cardiac), the liver, and kidney.
As the monocarboxylate transporter is also a symport for proton removal from the cell, lactate production also provides the means to assist in proton efflux from the cell. Thus lactate and a proton leave the cell stoichiometrically via this transporter mechanism.
However, this does not mean that lactate production is the source of the proton. As has been presented thus far, there is no biochemical evidence for lactate production releasing a proton, and research evidence is clear in quantifying far greater proton removal than lactate removal from contracting skeletal muscle (19).
Conversely, the organic chemistry of the LDH reaction clearly reveals that lactate production consumes protons. The correct physiological interpretation of these biochemical facts is that lactate production retards a developing metabolic acidosis, as well as assists in proton removal from the cell.
The coupling of glycolysis to lactate production. The end products of glycolysis and the lactate dehydrogenase reaction are provided in Eq. 3. When the pyruvate from glycolysis is converted to lactate, there is no net production of protons when starting with glucose, and a decrease in one proton and a gain of an additional ATP when starting with glycogen (Eq. 4).


Lactate dehydrogenase reaction. From a biochemical perspective, the cellular production of lactate is beneficial for several reasons. First, the lactate dehydrogenase (LDH) reaction also produces cytosolic NAD+, thus supporting the NAD+ substrate demand of the glyceraldehyde 3-phosphate dehydrogenase reaction.
This in turn better maintains the cytosolic redox potential (NAD+/NADH), supports continued substrate flux through phase two of glycolysis, and thereby allows continued ATP regeneration from glycolysis. Another important function of the LDH reaction is that for every pyruvate molecule catalyzed to lactate and NAD+, there is a proton consumed, which makes this reaction function as a buffer against cellular proton accumulation (acidosis). The chemical structures for the LDH reaction are presented in Fig. 9.

Fig. 9. Substrates and products of the lactate dehydrogenase (LDH) reaction. Two electrons and a proton are removed from NADH and a proton is consumed from solution to reduce pyruvate to lactate. Arrows pointing away from a bond represent bond/group removal. Arrows pointing to a bond represent addition of an atom/group.
____________________________________ |
In the LDH reaction, two electrons and a proton are removed from NADH, and an additional proton is gained from solution to support the two electron and two proton reduction of pyruvate to lactate. Consequently, the LDH reaction is alkalinizing to the cell, not acidifying, as is the basis of the lactic acidosis construct.
There are additional benefits of the LDH reaction. The lactate produced is removed from the cell by the monocarboxylate transporter (12, 20, 21, 30, 37, 62). The lactate is circulated away from the origin cell where it can be taken up and used as a substrate for metabolism in other tissues, such as other muscle cells (skeletal and cardiac), the liver, and kidney.
As the monocarboxylate transporter is also a symport for proton removal from the cell, lactate production also provides the means to assist in proton efflux from the cell. Thus lactate and a proton leave the cell stoichiometrically via this transporter mechanism. However, this does not mean that lactate production is the source of the proton.
As has been presented thus far, there is no biochemical evidence for lactate production releasing a proton, and research evidence is clear in quantifying far greater proton removal than lactate removal from contracting skeletal muscle (19). Conversely, the organic chemistry of the LDH reaction clearly reveals that lactate production consumes protons.
The correct physiological interpretation of these biochemical facts is that lactate production retards a developing metabolic acidosis, as well as assists in proton removal from the cell.
The coupling of glycolysis to lactate production. The end products of glycolysis and the lactate dehydrogenase reaction are provided in Eq. 3. When the pyruvate from glycolysis is converted to lactate, there is no net production of protons when starting with glucose, and a decrease in one proton and a gain of an additional ATP when starting with glycogen (Eq. 4).

Fig. 10. Substrates and products of the ATPase reaction. This reaction is referred to as a hydrolysis reaction (ATP hydrolysis) due to the involvement of a water molecule. An oxygen atom, 2 electrons, and a proton from the water molecule are required to complete the free inorganic phosphate product of the reaction. The remaining proton from the water molecule is released into solution. Arrows pointing away from a bond represent bond/group removal. Arrows pointing to a bond represent addition of an atom/group.
____________________________________ |
The Pi produced in the ATPase reaction has the potential to buffer the free proton that is released. The three single bond oxygen atoms of Pi have the following pK values: 2.15, 6.82, and 12.38 (28, 54). Thus one oxygen atom is able to become protonated within the intracellular physiological pH range (cellular pH range ∼6.1 to 7.1) converting the Pi from HPO4–2 to H2PO4–1. Consequently, as Pi increases during intense exercise, the proton buffering capacity of Pi is quantified by the extent of Pi accumulation when cellular pH falls well below 6.8.
At first glance, the buffering potential of Pi decreases the importance of ATP hydrolysis as a meaningful source of proton release contributing to acidosis. However, this is not true. The increase in intracellular Pi is not proportional to, and in fact considerably less than, the accumulated total of ATP hydrolysis.
During ATP hydrolysis, the ADP and Pi produced both function as substrates for glycolysis to produce ATP (Table 2, Fig. 11), leaving the free proton to accumulate when buffering and transport systems for proton efflux from the cell have been surpassed. Free Pi is also a substrate for glycogenolysis and is transported into the mitochondria as a substrate in oxidative phosphorylation. As such, Pi accumulation is not stoichiometric to ATP turnover and occurs when there is a greater rate of cytosolic ATP turnover than cellular ATP supply.
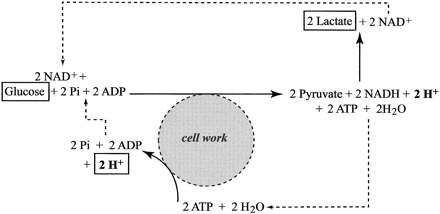
Fig. 11. Glycolytic regeneration of ATP coupled to ATP hydrolysis as would be the case during skeletal muscle contraction with no ATP contribution from mitochondrial respiration. Source of the protons that can accumulate in the cytosol is ATP hydrolysis. Balance of these reactions leaves the molecules highlighted by rectangles (glucose → 2 lactate + 2 H+; Eq. 5).
____________________________________ |
A diagrammatic model for the coupled connection between glycolysis and cytosolic ATP, ADP, and Pi turnover is presented in Fig. 11. When lactate production is added to glycolysis, and assuming that the ATP turnover from metabolism is not supported from mitochondrial respiration, the rate of proton release is equal to the rate of ATP turnover.
Under these circumstances, there would be a rapid release of protons, a rapid exceeding of the cellular proton removal and buffer capacities, and the rapid onset of cellular metabolic acidosis. When combining ATP hydrolysis and glucose conversion to lactate (Eq. 3 and Fig. 10), the content of Fig. 11 and Table 2 can be summarized in Eq. 5. Equation 6 presents the summary equation of the conversion of glycogen to lactate.


Obviously, Eqs. 5 and 6 appear as though lactic acid has been produced. However, as is detailed in this manuscript, to assume that such a summary equation is evidence for lactic acidosis is an interpretation based on an oversimplistic account of the biochemistry of metabolic acidosis. The content of Fig. 10 clearly shows the source of the two protons of Eq. 5 is ATP hydrolysis, not lactate production.
NADH + H+ as a source of H+. Additional H+ accumulation could arise from an accumulation of NADH + H+ produced by the glyceraldehyde 3-phosphate dehydrogenase reaction. These products would increase during any cellular condition that caused a greater rate of substrate flux through glycolysis than the rate of electron and proton uptake by the mitochondria, or lactate production (Fig. 9).
The importance of mitochondrial respiration. Although metabolic acidosis is caused by cytosolic (nonmitochondrial) catabolism, an understanding of why and when metabolic acidosis occurs in contracting skeletal muscle is partly explained by knowing how and why mitochondrial function can be rate limiting to ATP regeneration. To view metabolic acidosis as a nonmitochondrial event is a mistake, for as will be explained, the rate-limiting function of mitochondria is an important reason for the need to rely more on nonmitochondrial ATP turnover, which in turn causes metabolic acidosis.
A concise summary of the key metabolic events in mitochondria is presented in Fig. 12. Mitochondrial metabolism functions to release electrons and protons from substrates, produce carbon dioxide, and use electrons and protons to eventually produce ATP. The main molecules involved in these functions are acetyl CoA, NAD+, FAD+, molecular oxygen, ADP, Pi, electrons, and protons. It is important to note that each of ADP, Pi, and protons is transported into the mitochondria (6, 23) (Figs. 12 and 13).
The protons are required for the reduction of molecular oxygen, and ADP and Pi are required for ATP regeneration. Such transport mechanisms connect cytosolic and mitochondrial metabolism. This is especially true for the transfer of Pi molecules and protons between the cytosol and mitochondria. The proton transport systems between the cytosol and mitochondria are revealing of the power of mitochondrial respiration in contributing to the control over the balance of protons within the cell during conditions of muscle contraction that rely on mitochondrial respiration for ATP turnover.
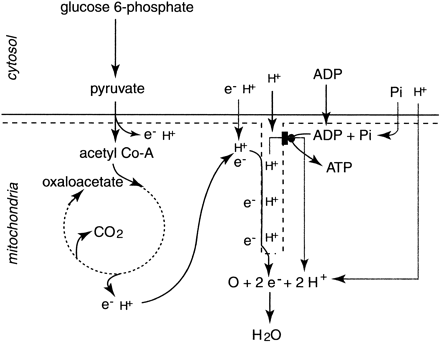
Fig. 12. A summary of the main reactions of mitochondrial respiration that support ATP regeneration. Note that each of cytosolic ADP, Pi, electrons (e–), and protons (H+) can enter the mitochondria (whether directly or indirectly) and function as substrates for oxidative phosphorylation.
____________________________________ |
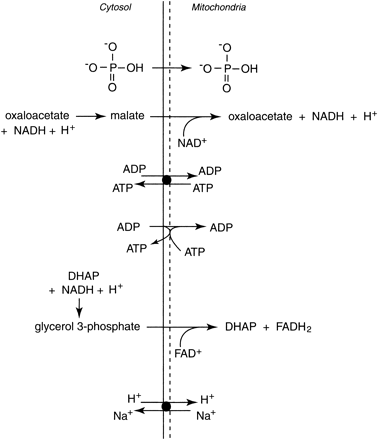
Fig. 13. Examples of the cytosolic metabolites that can diffuse or be transported into the mitochondria. Note that protons (H+) can enter the mitochondria indirectly via the malate-aspartate and glycerol-phosphate shuttles or directly via several cation exchange mechanisms. Note that complete reactions are not presented to simplify the diagram.
Figure 14, A and B, present two scenarios of metabolism pertinent to the study of acidosis. Figure 14A depicts the movement of carbon substrate, electrons, protons, and phosphate molecules within and between the cytosol and mitochondria during moderate intensity steady-state exercise where the rate of glycolysis and subsequent pyruvate entry into the mitochondria for complete oxidation and mitochondrial ATP regeneration meet the rate of cytosolic ATP demand.
Conversely, Fig. 14B pertains to non-steady-state exercise as is typified by intense exercise to volitional fatigue within a time frame of 2–3 min. In each figure example, the magnitude of the arrows is proportionate to substrate flux through that reaction or pathway.
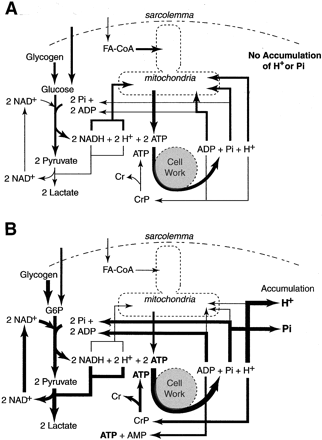
Fig. 14. Two diagrams representing energy metabolism in skeletal muscle during two different exercise intensities. A: steady state at ∼60% O2 max. Note that macronutrients are a mix of blood glucose, muscle glycogen, blood free fatty acids, and intramuscular lipid. Blood free fatty acids and intramuscular lipolysis eventually yield the activated fatty acid molecules (FA-CoA). Pyruvate, NADH, and protons produced from substrate flux through glycolysis are predominantly consumed by the mitochondria as substrates for mitochondrial respiration. The same is true for the products of ATP hydrolysis (ADP, Pi, H+). Such a metabolic scenario can be said to be pH neutral to the muscle cells. B: short-term intense exercise at ∼110%
O2 max, causing volitional fatigue in ∼2–3 min. Size of the arrows approximate relative dependence/involvement of that reaction and the predominant fate of the products. Note that Pi is also a substrate of glycogenolysis. In this scenario, cellular ATP hydrolysis is occurring at a rate that cannot be 100% supported by mitochondrial respiration.
Thus there is increased reliance on using cellular ADP for ATP regeneration from glycolysis and creatine phosphate. For every ADP that is used in glycolysis and the creatine kinase reaction under these cellular conditions, a Pi and proton is released into the cytosol. However, the magnitude of proton release is greater than for Pi due to the need to recycle Pi as a substrate in glycolysis and glycogenolysis.
As explained in the text, the final accumulation of protons is a balance between the reactions that consume and release protons, cell buffering, and proton transport out of the cell. This diagram also clearly shows that the biochemical cause of proton accumulation is not lactate production but ATP hydrolysis.
On the basis of the biochemistry presented thus far, Fig. 14 indicates the shift in proton flux as exercise progresses from steady state to nonsteady state. Central to the cellular proton balance is the hydrolysis of ATP required to fuel cell work, such as muscle contraction.
This is clearly the main source of proton release in contracting skeletal muscle, and when the NADH and protons from cytosolic reactions are produced at rates in excess of mitochondrial capacity, cytosolic redox is aided by lactate production, which essentially accounts for the proton release from glycolysis.
However, as the rate of ATP hydrolysis exceeds all other reactions, the rate of proton release eventually exceeds metabolic proton buffering by lactate production and creatine phosphate breakdown, as well as proton buffering by Pi, amino acids, and proteins.
In addition, once the maximal capacity of lactate/proton removal from the cell is exceeded, proton accumulation (decreasing cellular pH) results. Also, note that Fig. 14B clearly shows that the origin of the accumulating intramuscular Pi is ATP hydrolysis, not creatine phosphate breakdown, which is still mistakenly interpreted by many physiologists (59).
The additional underlying message of Fig. 14 is that the cellular mitochondrial capacity is pivotal in understanding metabolic acidosis. The mitochondrial capacity for acquiring cytosolic protons and electrons retards a dependence on glycolysis and the phosphagen system for ATP regeneration, essentially functioning as a depository for protons for use in oxidative phosphorylation. Metabolic acidosis occurs when the rate of ATP hydrolysis, and therefore the rate of ATP demand, exceeds the rate at which ATP is produced in the mitochondria. The maximal rates for ATP regeneration from the main energy systems of skeletal muscle are provided in Table 4.
____________________________________ |
Table 4.The estimated maximal rates of ATP regeneration from the main energy systems in skeletal muscle
|
|
| Energy System |
Maximal Rate of ATP regeneration, mmol ATP·s–1·kg wet wt–1 |
|
| Cytosolic |
| Phosphagen |
2.4 |
| Glycolytic |
1.3 |
| Mitochondrial respiration |
| CHO oxidation |
0.7 |
| Fat oxidation |
0.3 |
____________________________________ |
A classic study that showed the importance of mitochondrial proton uptake was conducted by Vaghy (57). Vaghy examined oxidative phosphorylation in isolated rabbit heart mitochondria and the accompanying pH changes in the same sample. It was suggested that when oxidative phosphorylation was blocked either by inhibitors or by the absence of oxygen the proton concentration would increase considerably.
The results of Vaghy's investigation revealed that during ischemic conditions there was a decreased net proton consumption by oxidative phosphorylation and that this alteration to metabolism plays an important role in the development of the acidosis of the myocardium. In addition, Vaghy experimentally confirmed the idea that when glycolysis and ATP hydrolysis are not coupled to mitochondrial respiration, acidosis develops. However, the question of where the protons came from was not clarified by this research.
____________________________________ |
ADDITIONAL RESEARCH EVIDENCE FOR THE PROTON RELEASING AND CONSUMING REACTIONS OF CATABOLISM
Although the biochemistry of exercise-induced metabolic acidosis is unquestionable, there is considerable research support and therefore validation of nonmitochondrial ATP turnover as the cause of acidosis. For example, several researchers have denoted that the assumption that "lactic acid" is the source of H+ is inaccurate.
Gevers (10, 11) first drew attention to the very important possibility that protons might be generated in significant quantity in muscle by metabolic processes other than the lactate dehydrogenase reaction. He suggested that the major source of protons was the turnover of ATP produced via glycolysis. This important concept, quite contrary to the general concept of that time that "lactic acid" is the end product of glycolysis, aroused little interest for six years.
It was not until 1983 that Hochachka and Mommsen (16) rediscovered and wrote an extensive review on this topic. Hochachka et al. supported Gevers' idea that metabolic acidosis resulting from glycolysis is primarily due to ATP hydrolysis by myosin ATPase that yields ADP, Pi, and H+. According to these authors, only ADP and Pi are recycled via glycolysis to produce ATP, leaving H+ behind to accumulate within the cytosol.
In other words, the glycolytic generation of ATP and ATPase-catalyzed hydrolysis of ATP are, to some extent, coupled (Fig. 11). Busa and Nuccitelli (4) also commented on this topic in an invited opinion in 1984. These authors essentially reaffirmed the writings of Gevers (10, 11) and Hochachka and Mommsen (16). As stated by Busa and Nuccitelli (4), "ATP hydrolysis, not lactate accumulation, is the dominant source of the intracellular acid load accompanying anaerobiosis."
To experimentally show that lactate production does not contribute to acidosis or that decreased lactate production exacerbates acidosis, glycolysis, lactate production, and mitochondrial respiration need to be uncoupled in a controlled manner. In a 31P-nuclear magnetic resonance (NMR) study, Smith et al. (48) investigated the role of "lactic acid" production in the isolated ferret heart by using three different applications of cyanide (cyanide blocks mitochondrial respiration), cyanide plus iodoacetate (inhibits glycolysis), and cyanide plus a glucose-free solution (restricts substrate to glycolysis).
The experimental results indicated that when only cyanide was applied to the heart muscle, there was a net lactate and H+ accumulation. When glycolysis was blunted (cyanide plus glucose-free solution), there was less lactate production, a greater rate of nonmitochondrial ATP hydrolysis, and increased acidosis. As expected, an increased acidosis with less lactate production was also observed when cyanide plus iodoacetate was applied to the myocardium. Therefore, the authors concluded that the increased acidosis produced by cyanide when glycolysis is completely inhibited (in the presence of iodoacetate) was due to a more rapid hydrolysis of intracellular ATP. In addition, these results showed the role of lactate production in thwarting a developing acidosis.
Later commentary by MacRae and Dennis (31) indicated that the metabolic generation of protons during heavy exercise is a consequence of the rise in glycolytic ATP turnover with increasing work rate. When ATP is resynthesized by glycolysis, rather than by oxidative phosphorylation or creatine phosphate, the protons produced by ATP hydrolysis are not reused in mitochondrial respiration. Conversely, during steady-state exercise the protons generated from glycolysis are transported into the mitochondria and used directly in water formation or used in the electron transport chain (ETC) to produce an H+ gradient across the inner mitochondrial membrane that facilitates ATP synthesis via the F0F1 ATPase.
Therefore, these protons are generated irrespective of lactate formation or pyruvate delivery to the mitochondria for oxidation. Consequently, an increase in cytosolic H+ concentration must also coincide with a decrease in cytosolic redox, which collectively shifts the LDH equilibrium toward lactate production (pyruvate– + NADH + H+ ↔ lactate– + NAD+). Thus lactate formation and efflux from working muscles is more a consequence than a cause of acidosis.
Noakes (34) recognized and supported the opinions of Gevers (10, 11) by stating that the protons released from the hydrolysis of ATP are not needed for the resynthesis of ATP by the glycolytic pathway. He also suggested that at first some of the protons generated by high rates of glycolytic ATP breakdown are taken into the mitochondria with pyruvate. Some are used in the reduction of pyruvate to lactate and some are buffered by intracellular histidine residues and Pi. Consequently, unbuffered intracellular protons leave the cell via the sarcolemmal Na+/H+ exchangers and H+ + lactate– symporters and can alter blood pH, which coincides with an increase in the blood lactate concentration.
____________________________________ |
COMPONENTS OF CELLULAR PROTON PRODUCTION, BUFFERING, AND REMOVAL
The cause of metabolic acidosis is not merely proton release, but an imbalance between the rate of proton release and the rate of proton buffering and removal. As previously shown from fundamental biochemistry, proton release occurs from glycolysis and ATP hydrolysis. However, there is not an immediate decrease in cellular pH due to the capacity and multiple components of cell proton buffering and removal (Table 5).
The intracellular buffering system, which includes amino acids, proteins, Pi, HCO3–, creatine phosphate (CrP) hydrolysis, and lactate production, binds or consumes H+ to protect the cell against intracellular proton accumulation. Protons are also removed from the cytosol via mitochondrial transport, sarcolemmal transport (lactate–/H+ symporters, Na+/H+ exchangers), and a bicarbonate-dependent exchanger (HCO3–/Cl–) (Fig. 13). Such membrane exchange systems are crucial for the influence of the strong ion difference approach at understanding acid-base regulation during metabolic acidosis (5, 26).
However, when the rate of H+ production exceeds the rate or the capacity to buffer or remove protons from skeletal muscle, metabolic acidosis ensues. It is important to note that lactate production acts as both a buffering system, by consuming H+, and a proton remover, by transporting H+ across the sarcolemma, to protect the cell against metabolic acidosis.
____________________________________ |
Table 5.Causes of acidosis and proton buffering in skeletal muscle
|
|
| Causes of Proton Release |
H+ Buffering and Removal
|
| Blood and ventilatory buffering |
Intracellular H+ buffering |
H+ removal |
|
| Glycolysis |
H+ + HCO3– |
Proteins |
Mitochondrial transport |
|
|
Amino acids |
|
|
H2CO3 |
CrP hydrolysis |
Lactate–/H+ Symport |
| ATP hydrolysis |
|
Lactate production |
Sarcolemmal Na+/H+ exchange |
|
H2O + CO2 |
IMP formation |
|
|
|
HCO3– |
HCO3–/Cl– Exchange |
|
|
Pi |
SID |
HCO3, bicarbonate; H2CO3, carbonic acid; CrP, creatine phosphate; SID, strong ion difference
____________________________________ |
THE STOICHIOMETRY OF LACTATE PRODUCTION AND PROTON ACCUMULATION IN CONTRACTING SKELETAL MUSCLE
Apart from biochemical facts, the most compelling additional evidence for the acidosis of nonmitochondrial ATP turnover in contracting skeletal muscle comes from a compilation of research that enables calculations of the components of proton release, buffering, and removal presented in Table 5.
Juel et al. (19) quantified lactate and proton release from contracting skeletal muscle during one-legged knee extensor exercise. The data of Fig. 15 were obtained from data of lactate and proton release during incremental exercise to fatigue and drawn as this original presentation. Clearly, muscle proton release was greater than lactate release, with the difference increasing with increases in exercise intensity with an almost twofold greater proton to lactate release at exhaustion.
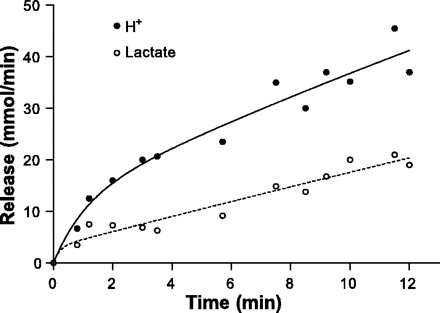
Fig. 15. Data for proton and lactate removal from contracting skeletal muscle. Figure is an original presentation of data from Juel et al. (19).
____________________________________ |
When concerned with intracellular nonmitochondrial ATP turnover and proton and lactate balance, the best exercise and research model to use is the quadriceps occluded blood flow model (50), as this minimizes the effect of blood flow on proton and lactate removal from the active muscle.
However, the highest calculations for nonmitochondrial ATP turnover (370 mmol/kg dry wt) come from Bangsbo et al. (1), who quantified muscle metabolites and blood lactate efflux from the quadriceps muscles during one-legged dynamic knee extensor exercise to exhaustion.
Bangsbo and colleagues (1, 2) argued that when totally accounting for all muscle lactate production (accumulation, removal, and oxidation), a more valid estimate of nonmitochondrial ATP turnover (ATP-NM) is obtained. The generally accepted equation (2) for this calculation is presented in Eq. 7.

When combining data from multiple studies (1, 33, 50, 51), with the data from Spriet and colleagues (50, 51) used for muscle metabolite accumulation during intense exercise to fatigue and the data from Bangsbo et al. (1) for ATP-NM, the data totally support the biochemically proven nonmitochondrial turnover origin of exercise-induced skeletal muscle metabolic acidosis.
For example, Fig. 16 represents the biochemical balance of protons if you assume that lactate production causes acidosis. The published data reveal that the muscle buffer capacity (structural and metabolic) is almost double that of lactate production. There is no stoichiometry to the assertion that lactate production directly releases protons and causes a lactic acidosis.
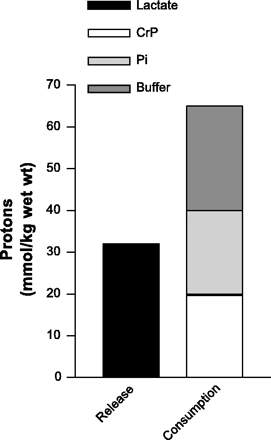
Fig. 16. Comparison between the theoretical proton release from lactate production to the known skeletal muscle buffer capacity (structural and metabolic). For example, if lactate production released protons, then the magnitude of the 2 columns of data should equal each other. Data for muscle lactate, CrP and Pi from Spriet et al. (49, 50). Data for muscle buffer capacity (by titration) from Sahlin (38) at 42 slykes for a muscle pH decrease from 7.0 to 6.4.
____________________________________ |
When evaluating past research for evidence in support of the nonmitochondrial ATP turnover cause of metabolic acidosis, the stoichiometry is far more impressive. These data are presented in Fig. 17. When the main consumers of protons are combined, there is a near equality between proton release (ATP-NM and glycolysis) and proton consumption.
____________________________________ |
A slight discrepancy is presented here, but in reality additional proton consumption occurs via the muscle bicarbonate stores, a small proton efflux that occurs regardless of exercise models having zero blood flow, and the influence of the strong ion difference across the sarcolemma of the contracting muscle fibers (5, 12, 26). Furthermore, we presented data assuming complete ionization of key metabolites such as ATP, ADP, and Pi.
This is not entirely accurate, yet adjustments based on proton balances from fractional ionization provide unnecessary complications to the proton balance, do not change the relative depiction of data, and therefore do not alter the cause of metabolic acidosis.
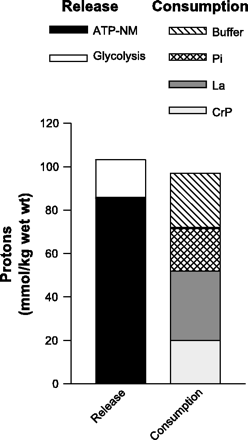
Fig. 17. Balance between intramuscular proton release and consumption based on fundamental biochemistry, as explained in the text. Data for nonmitochondrial ATP turnover (ATP-NM) from Bangsbo et al. (1) at 370 mmol/kg dry wt. Data for glycolysis from Spriet et al. (50) at 73.8 mmol glucosyl units/kg dry wt. Data for muscle lactate, CrP, Pi, and buffer capacity as for Fig. 16.
____________________________________ |
The data from Figs. 16 and 17 are very important as they show that nonmitochondrial ATP turnover is not just a theoretical explanation of metabolic acidosis, as is argued by many due to Eq. 5. The fact is that research clearly supports the stoichiometry of the nonmitochondrial ATP turnover cause of metabolic acidosis. In so doing, research also clearly discredits the interpretation of acidosis as being caused by lactate production.
Consequently, we showed that the biochemistry of metabolism supports nonmitochondrial ATP turnover as the cause of acidosis. Furthermore, we present data from experimental research that through direct measurement and indirect computations of the stoichiometry of proton and lactate balance in contracting skeletal muscle, prove that metabolic acidosis is caused by an increased reliance on nonmitochondrial ATP turnover and not lactate production.
____________________________________ |
IS THE DIFFERENTIATION BETWEEN LACTATE PRODUCTION AND THE TRUE BIOCHEMICAL CAUSE OF ACIDOSIS REALLY THAT IMPORTANT?
This is the crucial question that all physiologists must be able to answer. There are several examples of why the correct cause of metabolic acidosis needs to be accepted, communicated in education, and used in research interpretation and publication.
Scientific validity. The most important reason to discard the lactic acidosis concept is that it is invalid. It has no biochemical justification and, to no surprise, no research support. We have been criticized for our stance on the need to change how to teach and interpret metabolic acidosis based on Eq. 5 (glucose → 2 lactate + 2 H+).
However, this is a summary equation that does not represent cause and effect, as previously described and illustrated in Fig. 10. As such, the concept of a lactic acidosis remains evidence of 1920s academic and scientific inertia that, out of simple convenience and apathy, still remains today. We would hope that the academics and professionals from the basic and applied fields that continue to accept the lactic acidosis construct immediately change the way they teach and interpret this topic.
Education. Education is a powerful force that can induce change or reinforce error. Rather than continuing to reinforce error, educators need to recognize their power in reshaping how students and academics alike explain and discuss all matters pertaining to metabolic acidosis and skeletal muscle proton buffering. The correct teaching of metabolic acidosis is crucial for the promotion and acceptance of the correct understanding of exercise-induced metabolic acidosis.
Sports physiology, coaching, and training. An acceptance of the true biochemistry of metabolic acidosis means that terms and descriptions used throughout sports physiology and coaching need to be changed. The terms "lactate" or "lactic acid" need to be removed from any association with the cause of acidosis or the training that is used to delay the onset of acidosis.
Research of strategies to retard exercise-induced metabolic acidosis. If it is assumed that lactate production causes acidosis, then it is a logical extension to hypothesize that reducing lactate production for a given cellular ATP demand should retard acidosis. If decreasing the rate of lactate production is accomplished by stimulating increased mitochondrial respiration [such as through dichloracetate infusion/ingestion (18)], such a strategy might also increase mitochondrial proton uptake and decrease/delay acidosis.
However, as is clear from the biochemistry, for a given rate of mitochondrial respiration, decreasing lactate production will decrease proton buffering and removal from skeletal muscle and increase the rate of onset and worsen the severity of acidosis. On the basis of the biochemistry of muscle metabolism, the best way to decrease metabolic acidosis is to decrease nonmitochondrial ATP turnover by stimulating mitochondrial respiration. For a given ATP demand, any effort to decrease lactate production without increasing mitochondrial respiration will worsen metabolic acidosis.
Quantifying buffering: the unit of slyke. The buffer capacity or value of a solution was first quantified and defined by van Slyke in 1922 (24, 38). This initial definition was based on the amount of free H+ or OH– added to cause one unit change in pH (ΔH+/ΔpH). Typically, the reference mass of muscle is 1 kg. In 1955 it was recommended that Slyke's name be used as the unit expression for the buffering capacity of a tissue when quantified by the ΔH+/ΔpH ratio, and the unit of slyke has been used to quantify proton buffering ever since.
Traditionally, the buffer capacity of skeletal muscle is measured in vitro and is influenced by the structural constituents of skeletal muscle. Consequently, the buffer capacity does not include the proton removal from skeletal muscle metabolism or the transfer of protons from the cytosol to the mitochondria or out of the cell. Sahlin (38) referred to these two components of cell proton buffering as structural and metabolic, with the combination representing the total in vivo proton buffering capacity.
Unfortunately, when attempting to quantify the skeletal muscle buffer capacity in vivo the determination of protons added to a cell is difficult. To make this process easier, researchers have often assumed the source of the protons to be the production of metabolic acids: namely lactic and pyruvic acid. Obviously, this has been incorrect. The result has been an incorrect estimation of proton buffering, with such values varying from 60 to 80 slykes (24, 38, 49, 50).
When based solely on lactate production corrected for muscle water [Spriet et al. (50) used 3.3 l/kg dry wt], a value of 74.5 slykes is calculated, which clearly shows the bias of this unit in assuming lactate production contributes most of the proton release during muscle catabolism. As is clear from this review, such an approach to quantify skeletal muscle proton buffering is invalid and its use should never have been associated with the unit slyke.
On the basis of the content of this review, the best estimate of a muscle buffer capacity, which of course will vary with the degree and quality of exercise training of a given individual, is 208 slykes. This value is obtained from the data of Fig. 17, where 2–3 min of intense exercise to volitional exhaustion is associated with a pH decrease from 7.0 to 6.4, and the release/production of 125 mmol H+/kg muscle (125/0.6 = 208).
The total muscle buffer capacity is the sum of the components of structural and metabolic buffering. The data of Fig. 17 provide an estimate of metabolic buffering to be 120 (72/0.6) slykes, with 88 slykes remaining as structural buffering. Interestingly, our estimate of structural buffering is similar to that reported by Sahlin (38).
Past research estimates of the muscle buffer capacity from assuming lactate and pyruvate production estimate proton release are gross underestimations of the true muscle buffer capacity, as they do not account for all proton release (nonmitochondrial ATP hydrolysis), and in assuming lactate production is a source of protons rather than a consumer of protons, they underestimate metabolic proton buffering.
____________________________________ |
CONCLUSIONS AND RECOMMENDATIONS
There is no biochemical support for the construct of a lactic acidosis. Metabolic acidosis is caused by an increased reliance on nonmitochondrial ATP turnover. Lactate production is essential for muscle to produce cytosolic NAD+ to support continued ATP regeneration from glycolysis.
The production of lactate also consumes two protons and, by definition, retards acidosis. Lactate also facilitates proton removal from muscle. Although muscle or blood lactate accumulation are good indirect indicators of increased proton release and the potential for decreased cellular and blood pH, such relationships should not be interpreted as cause and effect.
The aforementioned interpretations of the biochemistry of lactate production and acidosis are also supported by research evidence. As such, research evidence also disproves the concept of a lactic acidosis. Quantifying nonmitochondrial ATP turnover during intense cycle ergometry exercise and assuming this value to be identical to proton release, reveals a near perfect stoichiometry to known components of proton consumption within contracting skeletal muscle.
Conversely, research data of muscle lactate production and proton release yield a lactate-to-proton stoichiometry approximating 1:3 (33:103 mmol H+/kg wet wt; Figs. 16 and 17).
Educating students on the correct biochemical cause of acidosis is extremely important for reasons of academic credibility and scientific validity. In addition, the past incorrect interpretations of lactic acidosis have yielded questionable research applications and data interpretations, with the indirect calculation of the muscle proton buffering unit of slyke {[(Δlactate + Δpyruvate)/ΔpH] ∼ (ΔH+/ΔpH)} being the best example of this error.
It is strongly recommended that all educators and researchers incorporate the application of the correct cause of acidosis into their professional practice.
____________________________________ |
ACKNOWLEDGMENTS
We want to highlight our recognition of the scientists and academics that preceded our efforts on constructively criticizing the concept of a lactic acidosis. These individuals and their scholarship (4, 7, 10, 11, 16, 34, 55–57, 60, 61, 63) collectively represent the original source of inspiration for writing this review. Such inspiration, combined with the largely ignored message that acidosis is not caused by lactate production, fueled our desire to write a comprehensive and critical review on such an important component of basic, applied, and clinical physiology and muscle metabolism.
____________________________________ |
FOOTNOTES
Address for reprint requests and other correspondence: R. A. Robergs, Exercise Science Program, Dept. of Physical Performance and Development, Johnson Center, Rm. B143, The Univ. of New Mexico, Albuquerque, NM 87131-1258 (E-mail: rrobergs@unm.edu)
____________________________________ |
REFERENCES
-
Bangsbo J, Gollnick PD, Graham TE, Juel C, Kiens B, Mizuno M, and Saltin B. Anaerobic energy production and O2 deficit-debt relationship during exhaustive exercise in humans. J Physiol 422: 539–559, 1990.
- Bangsbo J. Quantification of anaerobic energy production during intense exercise. Med Sci Sports Exerc 30: 47–52, 1998.
- Bernardi P. Mitochondrial transport of cations: channels, exchangers, and permeability transition. Physiol Rev 79: 1127–1155, 1999.
- Busa WB and Nuccitelli R. Metabolic regulation via intracellular pH. Am J Physiol Regul Integr Comp Physiol 246: R409–R438, 1984.
- Clarence DH. The Handbook of Biochemistry and Biophysics. Cleveland, OH: World, 1966.
- Corey HE. Stewart and beyond: new models of acid-base balance. Kidney Int 64: 777–787, 2003.
- Davis EJ, Bremer J, and Akerman KE. Thermodynamic aspects of translocation of reducing equivalents by mitochondria. J Biol Chem 255: 2277–2283, 1980.
- Dennis SC, Gevers W, and Opie LH. Protons in ischemia: where do they come from; where do they go to? J Mol Cell Cardiol 23: 1077–1086, 1991.
- Finkel KW and DuBose TD. Metabolic acidosis. In: Acid-Base and Electrolyte Disorders: A Companion to Brenner and Rector's The Kidney, edited by DuBose TD and Hamm LL. Philadelphia, PA: Saunders, 2002, p. 55–66.
- Fitts RH and Holloszy JO. Lactate and contractile force in frog muscle during development of fatigue and recovery. Am J Physiol 231: 430–433, 1976.
- Gevers W. Generation of protons by metabolic processes in heart cells. J Mol Cell Cardiol 9: 867–874, 1977.
- Gevers W. Generation of protons by metabolic processes other than glycolysis in muscle cells: a critical view [letter to the editor]. J Mol Cell Cardiol 11: 328, 1979.
- Hagberg H. Intracellular pH during ischemia in skeletal muscle: relationship to membrane potential, extracellular pH, tissue lactic acid and ATP. Pflügers Arch 404: 342–347, 1985.
- Harmer AR, McKenna MJ, Sutton JR, Snow RJ, Ruell PA, Booth J, Thompson MW, Mackay NA, Stathis CG, Crameri RM, Carey MF, and Eager DM. Skeletal muscle metabolic and ionic adaptations during intense exercise following sprint training in humans. J Appl Physiol 89: 1793–1803, 2000.
- Hill AV, Long CNH, and Lupton H. Muscular exercise, lactic acid, and the supply and utilization of oxygen. Proc R Soc Lond B Biol Sci 16: 84–137, 1924.
- Hill AV. Croonian lecture. Proc R Soc Lond B Biol Sci 100: 87, 1926.
- Hochachka PW and Mommsen TP. Protons and anaerobiosis. Science 219: 1391–1397, 1933.
- Holten CH, Muller A, and Rehbinder D. Lactic Acid: Property and Chemistry of Lactic Acid and Derivatives. Germany: Verlag Chemie, 1971.
- Howlett RA, Heigenhauser GJF, and Spriet LL. Skeletal muscle metabolism during high-intensity sprint exercise is unaffected by dichloroacetate or acetate infusion. J Appl Physiol 87: 1747–1751, 1999.
- Juel C, Klarskov C, Nielsen JJ, Krustrup P, Mohr M, and Bangsbo J. Effect of high intensity intermittent training on lactate and H+ release from human skeletal muscle. Am J Physiol Endocrinol Metab 286: E245–E251, 2004.
- Juel C. Lactate/proton co-transport in skeletal muscle: regulation and importance for pH homeostasis. Acta Physiol Scand 156: 369–374, 1996.
- Juel C. Lactate-proton cotransport in skeletal muscle. Physiol Rev 77: 321–358, 1977.
- Juel C. Muscle pH regulation: role of training. Acta Physiol Scand 162: 359–366, 1988.
- Kaplan RS. Structure and function of mitochondrial anion transport proteins. J Membr Biol 179: 165–183, 2001.
- Karlsson J. Lactate and phosphagen concentrations in working muscle of man. Acta Physiol Scand Suppl 358: 1–72, 1971.
- Katz A and Sahlin K. Regulation of lactic acid production during exercise. J Appl Physiol 65: 509–518, 1988.
- Kowalchuk JM, Heigenhauser GJF, Lindinger MI, Sutton JR, and Jones NL. Factors influencing hydrogen ion concentration in muscle after intense exercise. J Appl Physiol 65: 2080–2089, 1988.
- Laski ME and Wesson DE. Lactic acidosis. In: Acid-Base and Electrolyte Disorders: A Companion to Brenner and Rector's The Kidney, edited by DuBose TD and Hamm LL. Philadelphia, PA: Saunders, 2002, p. 835–108
- Lehninger AL. The Principles of Biochemistry (2nd ed). New York: Worth, 1982.
- Lusk G. The Elements of the Science of Nutrition. Philadelphia: Saunders, 1928.
- Lindinger MI and Heigenhauser GJ. The roles of ion fluxes in skeletal muscle fatigue. Can J Physiol Pharmacol 69: 246–253, 1991.
- MacRae HSH and Dennis SC. Lactic acidosis as a facilitator of oxyhemoglobin dissociation during exercise. J Appl Physiol 78: 758–760, 1995.
- Margaria R, Edwards HT, and Dill DB. The possible mechanisms of contracting and paying the oxygen debt and the role of lactic acid in muscular contraction. Am J Physiol 106: 689–715, 1933.
- Medbo JO and Tabata I. Anaerobic energy release in working muscle during 30 s to 3 min of exhaustive bicycling. J Appl Physiol 75: 1654–1660, 1993.
- Noakes TD. Challenging beliefs: ex Africa semper aliquid novi. Med Sci Sports Exerc 29: 571–590, 1997.
- Raju TN. The Nobel Chronicles. 1922: Archilbald Vivian Hill (1886–1977), Otto Fritz Meyerfhoff (1884–1951). Lancet 352: 1396, 1998.
- Robergs RA. Exercise-induced metabolic acidosis: where do the protons come from? Sportscience 5 [sportsci.org/jour/0102/rar. htm, 2001].
- Roth DA and Brooks GA. Lactate transport is mediated by a membrane-bound carrier in rat skeletal muscle sarcolemmal vesicles. Arch Biochem Biophys 279: 377–385, 1990.
- Sahlin K. Intracellular pH and energy metabolism in skeletal muscle of man. Acta Physiol Scand Suppl 455: 7–50, 1978.
- Sahlin K. NADH in human skeletal muscle during short-term intense exercise. Pflügers Arch 403: 193–196, 1985.
- Sahlin K, Edstrom L, Sjoholm H, and Hultman E. Effects of lactic acid accumulation and ATP decrease on muscle tension and relaxation. Am J Physiol Cell Physiol 240: C121–C126, 1981.
- Sahlin K, Edstrom L, Sjoholm H, and Hultman E. Effects of lactic acid accumulation and ATP decrease on muscle tension and relaxation. Am J Physiol Cell Physiol 240: C121–C126, 1981.
- Sahlin K, Harris RC, Nylind B, and Hultman E. Lactate content and pH in muscle samples obtained after dynamic exercise. Pflügers Arch 367: 143–149, 1976.
- Sahlin K and Henriksson J. Muscle buffer capacity and lactate accumulation in skeletal muscle of trained and untrained men. Acta Physiol Scand 122: 331–339, 1984.
- Sahlin K, Katz A, and Henriksson J. Redox state and lactate accumulation in human skeletal muscle during dynamic exercise. Biochem J 245: 551–556, 1987.
- Sahlin K, Tonkonogi M, and Soderlund K. Energy supply and muscle fatigue in humans. Acta Physiol Scand 162: 261–266, 1998.
- Sahlin K. Metabolic changes limiting muscle performance. In: Biochemistry of Exercise, edited by Saltin B. Champaign, IL: Human Kinetics, 1986, vol. 16, p. 323–344.
- Shampo MA and Kyle RA. Otto Meyerhoff—Nobel Prize for studies of muscle metabolism. Mayo Clin Proc 74: 67, 1999.
- Smith GL, Donoso P, Bauer CJ, and Eisner DA. Relationship between intracellular pH and metabolite concentrations during metabolic inhibition in isolated ferret heart. J Physiol 472: 11–22, 1993.
- Spriet LL, Sodeland K, Bergstrom M, and Hultman E. Aerobic energy release in skeletal muscle during electrical stimulation in men. J Appl Physiol 62: 611–615, 1987.
- Spriet LL, Sodeland K, Bergstrom M, and Hultman E. Skeletal muscle glycogenolysis, glycolysis, and pH during electrical stimulation in men. J Appl Physiol 62: 616–621, 1987.
- Spriet LL. Anaerobic metabolism in human skeletal muscle during short-term, intense activity. Can J Physiol Pharmacol 70: 157–165, 1992.
- Stringer W, Wasserman K, Casaburi R, Porzasz J, Maehara K, and French W. Lactic acidosis as a facilitator of oxyhemoglobin dissociation during exercise. J Appl Physiol 76: 1462–1467, 1994.
- Stringer W, Casaburi R, and Wasserman K. Acid-base regulation during exercise and recovery in humans. J Appl Physiol 72: 954–961, 1992.
- Stryer L. Biochemistry (4th ed). San Francisco: Freeman, 1995.
- Tafaletti JG. Blood lactate: biochemistry, laboratory methods and clinical interpretation. CRC Crit Rev Clin Lab Sci 28: 253–268, 1991.
- Trump BD, Mergner WJ, Kahng MW, and Saladino AJ. Studies on the subcellular pathophysiology of ischemia. Circulation 53: I17–I26, 1976.
- Vaghy PL. Role of mitochondrial oxidative phosphorylation in the maintenance of intracellular pH. J Mol Cell Cardiol 11: 933–940, 1979.
- Webster’s Ninth New Collegiate Dictionary. Springfield: Merriam-Webster, 1984.
- Westerblad H, Allen DG, and Lannergren J. Muscle fatigue: lactic acid or inorganic phosphate the major cause? News Physiol Sci 17: 17–21, 2002.
- Wilkie DR. Generation of protons by metabolic processes other than glycolysis in muscle cells: a critical view. J Mol Cell Cardiol 11: 325–330, 1979.
- Williamson JR, Schaffer SW, Ford C, and Safer B. Contribution of tissue acidosis to ischemic injury in the perfused rat heart. Circulation 53: I3–I16, 1976.
- Wilson MC, Jackson VN, Heddle C, Price NT, Pilegaard H, Juel C, Bonen A, Montgomery I, Hutter OF, and Halestrap AP. Lactic acid efflux from white skeletal muscle is catalyzed by the monocarboxylate transporter isoform MCT3. J Biol Chem 273: 15920–15926, 1998.
- Zilva JF. The origin of the acidosis in hyperlactataemia. Ann Clin Biochem 15: 40–43, 1978.
________________________________________ |
http://ajpregu.physiology.org/content/287/3/R502.long
|